An independent high-school research and education project by Sophie Yang. This is not the state's official invasive-plant network. For official Connecticut guidance, see the Connecticut Invasive Plant Working Group (CIPWG).
Explore the map
Here is an interactive map of my 1,402 real occurrence records and the clusters they form. Click any point to see its species, year, and source. Toggle the Gi* hotspots, the monitoring-priority layer, or the density heatmap, and switch between street and satellite.
Every layer is real data. Open the map full-screen →
I combined a field-survey design with real public datasets to test one idea from two directions: the idea that invasion tracks human disturbance. The headline result below comes from real occurrence records and real land-cover data. My fine-scale field analysis is built and validated, ready for the data I will collect this season.
Why I'm doing this research
I'm a high school student, and honestly, my favorite place to be is outside, paying close attention to the world around me.
The more time I spent in the woods, fields, and trails near my school, the more I started noticing changes that are easy to walk right past. A streambank taken over by a single plant. A forest edge slowly filling in with the same climbing vine. These changes are quiet and slow, but they are reshaping places I care about, and I wanted to really understand them instead of just walking by.
So I combined real public biodiversity data, GIS analysis, and a field-survey design I will use to test the pattern on the ground. I looked at where invasive species pile up, how that lines up with the edges people disturb, and what it means for the habitats nearby.
Most of all, I want this to be useful, not just a report that sits on a shelf. I want to help other students and neighbors recognize these plants in our own backyard, understand why disturbed edges matter so much, and see that there are real things we can do about it. My hope is to turn what I noticed on a walk into something my community can act on.
The target species
I chose four species that are all on Connecticut's official invasive plant list, and that spread and grow in different ways. That lets me ask not just whether they cluster at edges, but why their patterns differ.
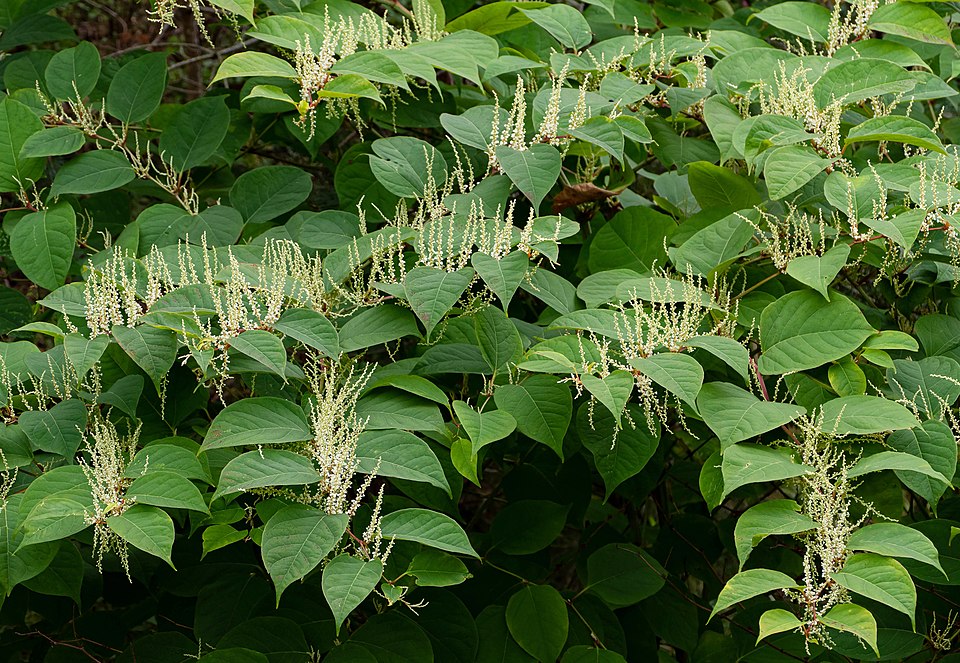
Japanese knotweed
Clonal perennial spread by rhizome fragments, water, and fill. Tied tightly to roadsides, riverbanks, and disturbed soil.
Photo: W. Carter, CC0 (Wikimedia Commons)
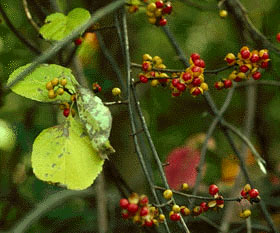
Oriental bittersweet
Woody vine with bird-dispersed seeds. A classic forest-edge invader that exploits light gaps.
Photo: public domain (Wikimedia Commons)
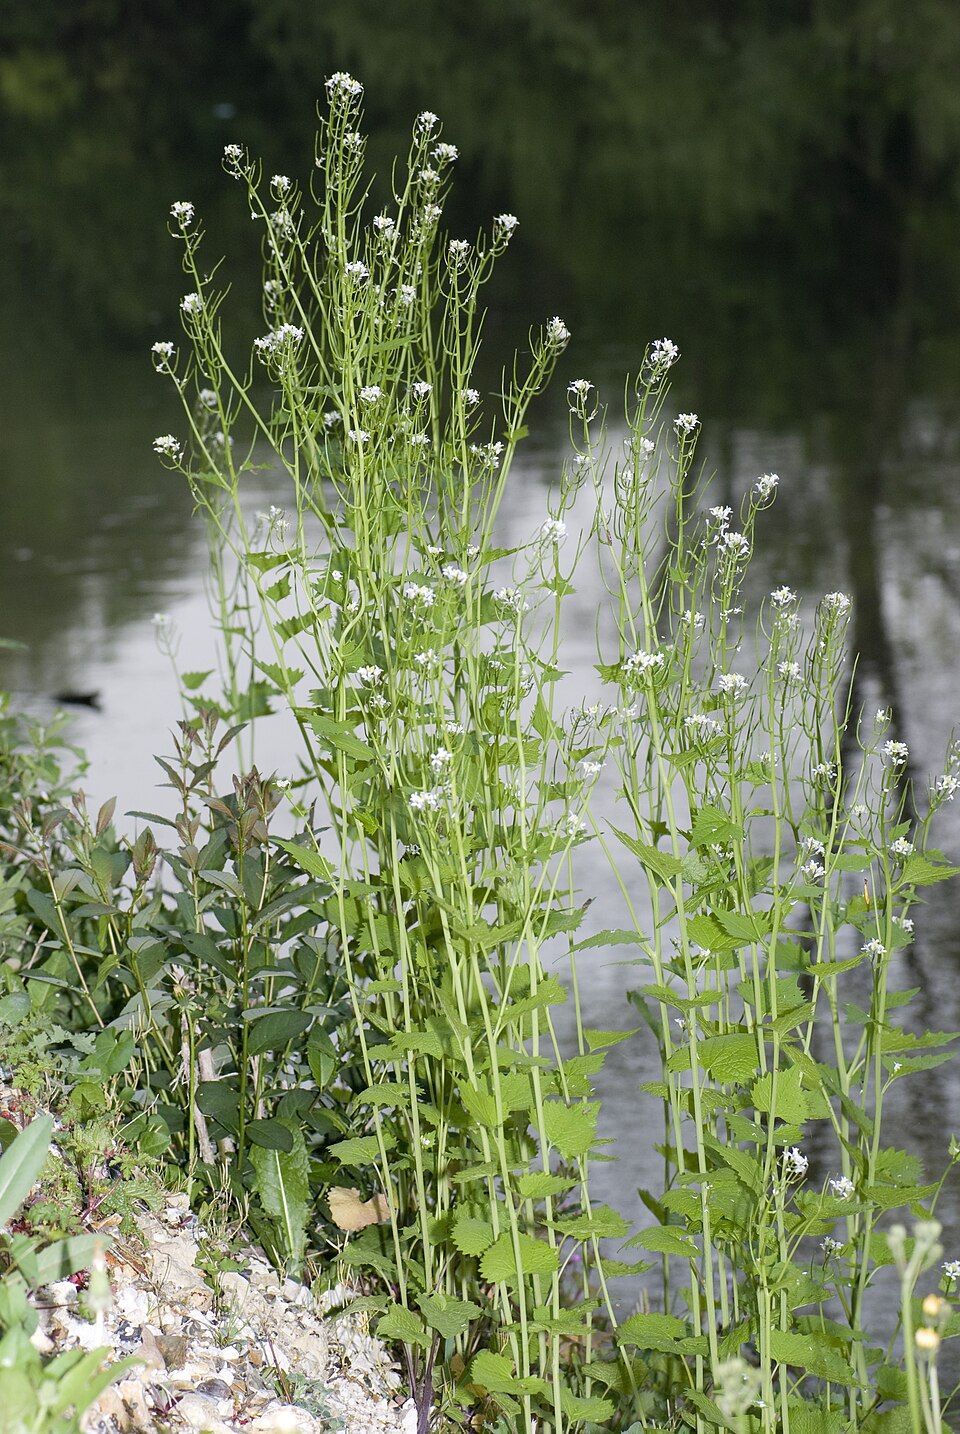
Garlic mustard
Shade-tolerant biennial herb spread along trails by boots and deer. Easy to identify, with a strong ecological story.
Photo: O. Pichard, CC BY-SA 3.0 (Wikimedia Commons)
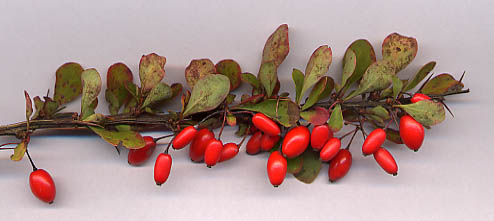
Japanese barberry
Spiny, shade-tolerant shrub of the forest understory, spread by birds. Its dense thickets also raise the density of Lyme-carrying ticks.
Photo: User:MPF, CC BY-SA 3.0 (Wikimedia Commons)
Most recorded vs. most harmful
A common invasive is not the same as the most damaging one. GBIF record counts measure how often people report a plant, not the harm it does, so I looked at both. By GBIF records near my sites, garlic mustard is the most reported, followed by Japanese barberry and burning bush. By ecological harm the picture is different:
- Japanese knotweed is often called the most damaging: it forms near-total monocultures along stream banks, worsens erosion, and is famously almost impossible to remove.
- Japanese barberry adds a public-health cost to its ecological one. Forest with barberry thickets averages roughly 12 times more Lyme-disease-carrying ticks than forest without it, because the humid thickets shelter the ticks.
- Oriental bittersweet girdles and topples mature trees, collapsing whole canopies.
- Garlic mustard is allelopathic: it disrupts the soil fungi that native tree seedlings and wildflowers depend on.
Species selection follows Connecticut's official invasive plant list. Sources: CT Invasive Plants Council / UConn; barberry and Lyme ticks: UConn / CT Agricultural Experiment Station and Williams et al.
Study area
The study area includes northwest and central Connecticut, with special attention to two community landscapes: Avon and the Farmington Valley, where I grew up, and Lakeville/Salisbury, where I attend school.
Public occurrence records show broader regional patterns. The field-study sites are designed to test those patterns at the local habitat scale, especially along roads, trails, fields, stream corridors, and forest edges. Seven sites span both areas:
Northwest hills
- Hotchkiss farm area, with field margins and farm edges
- Campus trail / forest edge, where foot traffic disturbs the trail
- Roadside / field boundary near campus, with road and mowed edges
- Great Mountain Forest vicinity, a large conservation forest I use as an interior reference
Farmington Valley (closer to home, with friends nearby to help)
- Avon, Farmington Canal trail and roadside edges
- Simsbury, town open space and rail-trail edges
- Farmington, Farmington River trail and field margins
How I approached it
Field survey
Belt transects perpendicular to edges, with quadrats at 0-50 m, recording cover, canopy, and native richness.
Statistics & spatial models
Mixed models and GAMs for the edge gradient; Getis-Ord Gi* for clustering; a conservation-priority map.
Real-data validation
GBIF occurrence records and CT ECO land cover to corroborate the pattern independently, at landscape scale.
🌿 Help stop their spread and protect our environment
Recognizing these species is the first step. Anyone can help: learn them, report them, remove small patches early, and plant native instead. Take one action today.